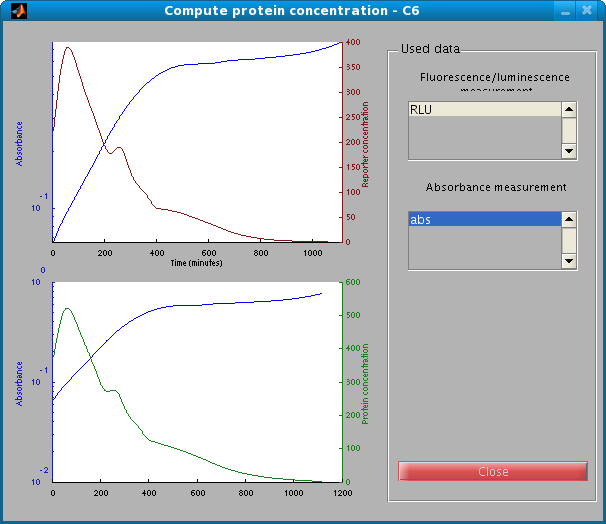
In this window, two curves are computed:
The computation of the reporter and host protein concentrations is based on the measured absorbance level. It is therefore possible to select which absorbance measurement to use if more than one is available. Parameters specified in the degradation constants and detection limits windows are used for the computation of the concentration curves.
Please refer to the paper for more details on the computation of reporter and host protein concentrations.
It is possible to export the data in the plot to a MATLAB M-file by right-clicking the graph, and then choosing Export graph data. Data is saved into an m-file, in a structure named data.