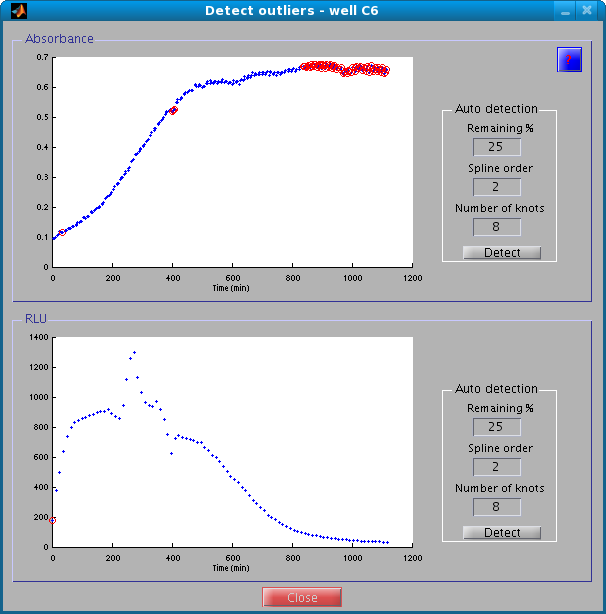
The outlier detection window allows you to mark outliers and remove them from further analysis. As shown below, outlier detection operates on a plot of the data, one plot for each type of measurement (absorbance, luminescence, and fluorescence). Valid data points are blue, whereas outliers are surrounded by a red circle.
If there are several measurements of each type, then a listbox allows you to switch between those.
The first way to select outliers is manually, by means of the mouse. This can be done in several ways:
Sometimes data points are too close to be clearly distinguishable. In these cases, you can zoom in or out in one of the following ways:
If there are many outliers, manual detection may become cumbersome. In this case, you can use the automatic outlier detection procedure, based on iterative fits of a regression spline. After each fit, the data with the highest residuals are removed. The user can specify some parameters to control this procedure, notably the order of the spline, the number of knots, and a lower limit on the percentage of remaining points.