Table of Contents
The initial step in modeling a genetic regulatory network is the collection of information on the genes, the proteins, and their mutual interactions that one wishes to take into account. This information can be obtained from the experimental literature and completed with plausible hypotheses. Notice that the collection of information, which may take a sizeable amount of the total time invested in the modeling project, does not yet require the use of GNA (although other computer tools may be involved, like biological data and knowledge bases). Instead, this step demands reflection on the precise biological questions to be addressed, followed by a careful evaluation of available experimental data.
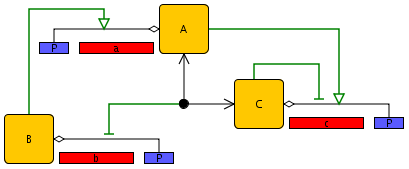
The results of the initial step can be summarized by means of an annotated schema of the genetic regulatory network, as illustrated in Figure 2.1. The schema in the example shows three genes and their promoters. Each gene codes for a protein that controls the expression of one or more target genes, possibly in cooperation with proteins encoded by other genes. In the figure, gene b codes for a protein that activates the transcription of gene a, while gene a and gene c code for proteins that form a heterodimer inhibiting the transcription of gene b. In addition, protein A activates gene c, while protein C inhibits the expression of its own gene. Activation and inhibition of gene expression are indicated by open arrows and bars, respectively. Although a schema usually does not contain all information required to build a mathematical model, it gives a good first impression of the regulatory structure of the network.