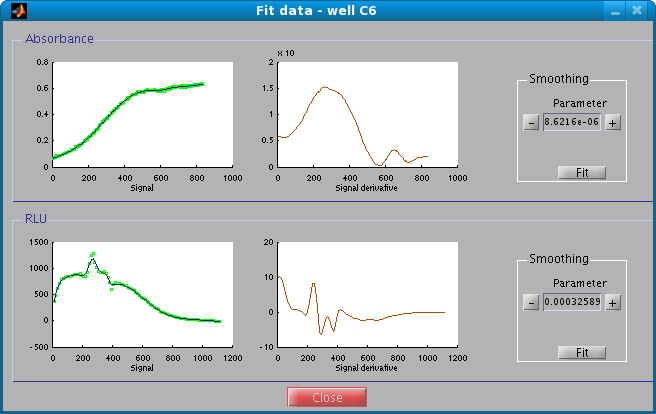
The fit window allows you to fit a smoothing spline to the data, after background correction if appropriate. This fit is critical for the computation of promoter activities and protein concentrations. It is therefore important to obtain a curve that captures the dynamic features in the data without overfitting. A smoothing parameter is automatically computed, but human intervention is often necessary to find the right degree of smoothing.
For each type of measurement (absorbance, luminescence and fluorescence), two plots are drawn. The left one shows the signal (in green) and the spline fit (in blue). The right one shows the derivative of the spline fit. This is a good way to visualize the quality of the fit. If corrected data are available, the fit is applied to these data; otherwise, the original data are used.
In the field right next to the plot, you can adjust the smoothing parameter (a value between 0 and 1). The smaller the number, the smoother the spline. You can: