In every domain of the phase space, the system behaves in a qualitatively identical way, in the sense that the concentration variables have a unique derivative sign pattern in the domain (see the section on the specification of initial conditions). For this reason, a domain can be seen as representing a qualitative state of the system. A transition between qualitative states occurs, if the concentration variables have evolved in such a way that the system leaves one domain and enters another. The simulation algorithm of GNA recursively computes all qualitative states that are reachable through one or more transitions from the qualitative state(s) corresponding to the initial domain(s). This results in a state transition graph, summarizing the qualitative dynamics of the system. The graph contains qualitative steady states or qualitative cycles, which may correspond to steady states and limit cycles, respectively, of the underlying piecewise-linear differential equations. Notice that, due to the mathematical techniques used to describe the dynamics of the system in threshold planes, the steady states located on the thresholds of the concentration variables may be sets instead of points (see the GNA publications for mathematical details).
Once you have defined a model of the genetic regulatory network and appropriate initial conditions, GNA allows you to perform a qualitative simulation of the network. First, you need to define the simulation parameters, either by choosing in the menu, or by pressing the corresponding button in the Initial conditions window. This opens the Properties page of the Simulation window, in which you can set the time-out parameter and the maximum number of states of the state transition graph that will be displayed. In addition, you can specify whether the simulation should be constrained to the initial conditions only or not. That is, by checking this option GNA only computes the transitions between the qualitative states corresponding to domains included in the initial conditions, and does not consider transitions to other states. This gives rise to a reduced state transition graph, summarizing the qualitative dynamics of the system in a specific region of the phase space, for instance the dynamics of the system around a steady state.
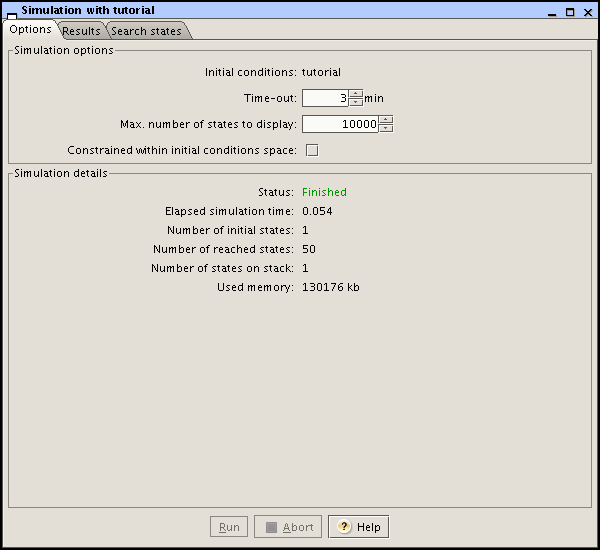
The actual simulation is launched by choosing in the Simulation window or in the menu. The program displays run-time statistics in the Simulation window, as shown in figure Figure 2.11, and allows you to abort the simulation.
Fig. 2.11. Simulation window after running the model of the genetic regulatory network in Figure 2.1

A qualitative simulation can also be launched from the console using the MS-DOS, Linux, Unix, or MacOS command:
gna [-p] [-v] [-q] [-e <plugin-directory>]
    [-f] [-i <file>] <project/model>
The argument project/model is mandatory and refers
to the project file (extension .gnaml) or the model file used in previous
GNA releases (extension .gna). The
-p option (also accessible through
--presentation-mode) is set to user when GNA is started from the command line
by the user, and to system when GNA
is called from within another application. The trace level determines the
amount of trace information generated during the simulation, and can be
adjusted through the -v (--verbose) and
-q (--quiet) options. If the project
does not contain any initial conditions, and the -i
(--initial-conditions) option is not specified, the
regulatory network is simulated for all possible initial conditions. That
is, GNA generates a state transition graph containing all possible
qualitative states of the system. (However, note that in enumerating the
possible qualitative states, GNA omits any qualitative states associated
with domains in which an input variable assumes a threshold value).
As will be explained in section Section 2.7, the simulation
results can be analyzed by means of a model checker. The command
gna is able to generate model-checker specific output,
as defined by customized plug-ins. The option -e
(--export) provides the plug-in directory. In case that
the simulation results are an explicit state transition graph, one can
additionally filter the instantaneous states of the state transition graph
through the -f option
(--filter-instantaneous-states).
The command
gna --help
displays the meaning of the arguments.

