Table of Contents
The initial step in modeling a genetic regulatory network consists of the unambiguous definition of the network structure and the representation of this information in visual form. The genes, proteins, and interactions making up the network are obtained from the experimental literature and completed with plausible hypotheses. Notice that the collection of this information may take a sizeable amount of the total time invested in the modeling project, as it demands reflection on the precise biological questions to be addressed, followed by a careful evaluation of the available experimental data.
The network editor of GNA supports the modeler in defining and representing the network structure. It takes its inspiration from the visual modeling language MIM (Molecular Interaction Maps) developed by Kohn and colleagues, and adheres as much as possible to the visualization standard proposed in the Systems Biology Graphical Notation (SBGN) project. The network editor is built upon the IogmaNetwork library developed by Genostar in the framework of the COBIOS project.
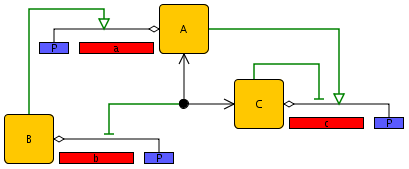
In order to illustrate the construction of a genetic regulatory network by means of the network editor, we consider a small network of three genes. Each gene codes for a protein that controls the expression of one or more target genes by binding to the promoter region. In particular, gene b codes for a protein that activates the transcription of gene a, while gene a and gene c code for proteins that form a heterodimer inhibiting the transcription of gene b. In addition, protein A activates gene c, while protein C inhibits the expression of its own gene.
The network can be created from the elements shown in the toolbar, among which we find genes and promoters, proteins, complex formation reactions, and activating and inhibiting interactions. Upon selecting a network element, the user is asked to specify the name of the gene or the protein. The position of the network elements in the editor can be changed by selecting an element and dragging it to another location using the mouse or the keyboard arrows. The network lay-out can be modified by adding or removing breakpoints in the lines representing the complex formation reactions and regulatory interactions. These breakpoints are added by means of mouse clicks while holding the Shift key down and can be moved like other network entities. The result for the example network is shown in Figure 2.1. To create reactions with multiple inputs and/or outputs, create first a simple reaction, then use the reaction tool again between the entity you want to add and the targeted part of the reaction (either its start, or its end).
The network thus constructed is saved in a so-called project. You can save the project by choosing in the menu.When saving the schema, the lay-out is stored as well. You can also start a new project or load an existing project by choosing the corresponding options in the menu.
In Figure 2.1 only a limited range of biochemical mechanisms involved in gene regulation was used, notably activation and inhibition of gene expression by transcription factors and the formation of protein complexes through dimerization. The network editor allows a much wider range of biochemical mechanisms to be described, as illustrated in Figure 2.2. Examples include:
Enzymatic reactions (the reaction transforming E into F, catalyzed by D);
Post-translational modifications (the modification of B into B*, induced by an external signal);
Active degradation of proteins and mRNA (the degradation of C, regulated by B*).
The types of network elements and biochemical reaction mechanisms supported by the network editor are shown in the menus and the toolbar (see Section 2.8).
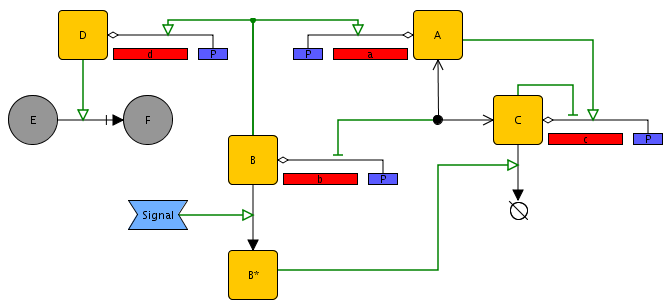
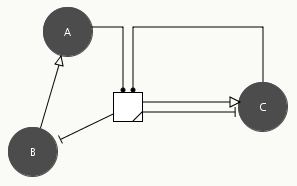
Figure 2.2 gives an impression of the diversity of the elements composing a genetic regulatory network. For our purposes, it is convenient to have a more restricted view of a genetic regulatory network, as consisting of genes, gene products (proteins and mRNAs), and the direct and indirect regulation of gene expression exerted by the gene products. This results in a reduced network structure where boxes represent indirect regulatory interactions mediated by, for example, protein-protein interactions, metabolism, and signal transduction. The construction of these boxes is based on the assumption that the latter processes are typically fast on the time-scale of gene expression. A detailed explanation of this reduction step is beyond the scope of this tutorial, but more details can be found in publications listed in the literature section.
The reduction process is computed automatically and the user can see the result at any time by pressing the button in the toolbar. Figure 2.3 shows the result for the simple three-gene network in Figure 2.1. The grey circles represent the proteins and the arrows the direct and indirect regulatory interactions controlling their synthesis and degradation. Notice that the reduction step has introduced a box mediating the influence of A and C on the expression of the gene encoding protein B. This influence is exerted through the heterodimerization of A and C, an interaction no longer explicitly represented but hidden in the box. The user can easily switch back and forward between the full and reduced network representation, thus making it possible to directly verify the pattern of indirect interactions induced by particular hypotheses on the biochemical mechanisms involved in gene regulation.