
In addition to the binary format of MATLAB, WellReader is currently able to handle two external formats.
The first one is a primary data format (.csv files), used to import data produced by a specific microplate reader device (Fusion, Perkin Elmer). Analysis results cannot be stored in this format.
The second format is an XML format. It is used for compatibility with other software, and it contains exactly the same information as the binary format. You can import from or export to this format.
The primary data file produced by the Fusion microplate reader is a comma-separated text file, which contains information on the experiment and the measurements, as well as the actual data. The file is automatically processed by WellReader's parser, but may require user intervention in some cases.
For each data line read in the file, WellReader expects to find five fields:
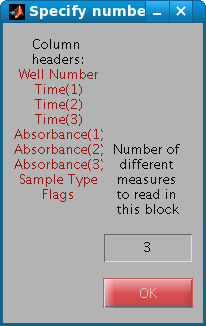
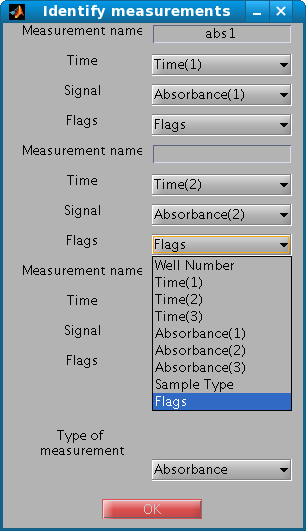
If more information is found, this means that more than one reading is present on the line. This notably occurs in the case of replicates of a measurement. In order to cope with this situation, WellReader asks you to specify which column contains what information. WellReader first needs the number of readings on the line, and then the correct identification of the measurements.
Once the file has been fully read, there are a few more steps required before you can start the analysis. The major one concerns defining the backgrounds: which measurements should be corrected and which not, and which wells should be used for this purpose? The backgrounds can also be defined later during the analysis, if modifications are required, by using the Edit menu or the toolbar shortcut.
Before entering the main window, you can launch the automatic detection of erratic data points called 'outliers'. At this step you must select the list of measurements you want the automatic detection function to be applied to and launch the detection function. The automatic detection of outliers can also be skipped at this step and done later using the outlier detection module.
For compatibility with other software, it is possible to export the data and the results of the analysis to XML. Of course, compatible XML can be imported too, similar to a .mat file.
Note, however, that parsing XML is far more time consuming than using the binary format. Use XML therefore only in the way it was meant to, namely for interacting with other software.